Every spring and fall students from leading technical universities across Europe head to another institution in the ATHENS network to take part in a one week intensive course on a topic of their choice. This March was the second time I had the opportunity to take part in this program. Two years ago I went to Télécom ParisTech to explore how information can be extracted from unstructured data sources such as the Wikipedia. I published a short writeup of that here.
This time around, I went to Technical University of Delft to look into how Data Science can be used to improve Software Engineering. The course was taught by Alberto Bacchelli who is SNFS Professor of Empirical Software Engineering at the University of Zurich and came back to TU Delft to teach two courses during ATHENS week. He is one of the leading figures in the field of Data Science in Software Engineering (also called Empirical Software Engineering) and has a ton of relevant publications.
All of us students arrived in Delft already on Saturday and so we had enough time to explore the city with a guide from the local students association BEST on Sunday during the day, take part in a pub crawl Sunday evening to experience the local nightlife and to get to know the best places to grab a coffee during a campus tour on the following Monday. After a short welcoming speech by university officials, most courses started Monday at noon. Ours, however, did not begin until later in the afternoon, so we used the opportunity to grab a bite to eat in the city center and climb the historic church tower overlooking the market square.

Our course started with a general introduction to the topic of Data Science for Software Engineering, which we defined as using data analysis on the data generated by the software engineering process with the hope of gaining insights that help improve it.
Next, we discussed various ways of quantifying how buggy software artifacts are and also ways of measuring code ownership. This gave us the necessary background to understand a well-known paper out of Microsoft Research: Don’t Touch My Code! Examining the Effects of Ownership on Software Quality. In it, the authors managed to show that higher code ownership leads to less defects.
Our task for the remaining four days would be to attempt to reproduce the results of this study for a different software repository and examine whether this relationship also holds there.
The projects we examined in teams of four were all open-source products which seems to lead to development processes that are very different from the ones employed at big companies such as Microsoft. This made it even more interesting to see whether we would be able to obtain the same results.
I was extremely lucky to be part of quite an international team with members from three different countries and unis: Italy (Politecnico di Milano), Poland (Politechnika Warszawska) and (of course) Germany (TUM).
The project we chose to examine was the Rust programming language which has both a very high number of commits and also quite a high number of developers contributing to it which means there was enough data to base an analysis on. The source of all the data for our analysis was the version control system used by the developers (Git in our case).
On the second day of the course, we calculated various metrics associated with ownership for all the individual files in the project such as the number of people who modified a file (total), how many of those contributors were major contributors and how many minor (a developer is considered to be a minor contributor if their commits make for less than 5% of total commits) and ownership (which is defined as the percentage of commits made by the contributor who made the most commits). For this first task we built our own solution in Python which used GitPython.
For the subsequent assignments we decided to switch to RepoDriller, an OpenSource framework for analyzing repositories developed by two of Prof. Bacchelli’s PhD students, so we could focus on the data gathering without having to worry about the internals of Git too much.
We spent the third day obtaining estimates for how many bugs each file contained post-release: To do this, we looked at commits made after the release and tried to find out if they contained a bugfix by checking whether the associated commit message contained certain keywords such as fix, resolves or bug. We then used git blame to go back in history and see if the lines that caused the problem were introduced in the timeframe relevant for our analysis (between release date and 6 months later). On the fourth day, we performed a statistical analysis of our results using R which we then presented on the final day of the course.
Let’s take a look at our results now: After discarding files that did not contain source code we were left with a total of about 6000 files which contained about 2300 bugs spread across 500 files. The biggest share were over 200 files that contained exactly one bug.
It is well-studied that the number of bugs correlates with the size of source code (lines of code, LoC) and churn (total number of lines removed and added), so we collected these variables as well and first performed a multi-linear regression using those variables:
                  Estimate Std. Error t value Pr(>|t|)
(Intercept)      -3.66e-02   2.26e-02   -1.62      0.1
cleaned_ds$churn  1.04e-03   2.72e-05   38.31   <2e-16 ***
cleaned_ds$size   1.60e-03   9.14e-05   17.52   <2e-16 ***
---
Signif. codes:  0 ‘***’ 0.001 ‘**’ 0.01 ‘*’ 0.05 ‘.’ 0.1 ‘ ’ 1

Multiple R-squared:  0.494,	Adjusted R-squared:  0.494
As shown, we found positive correlations of both features with post-release bugs. These correlations are highly significant (p < 0.001). The coefficient of determination (adjusted r^2) is 0.494.
Next, we analyzed the number of post-release bugs in a file as a function of just our independent variables minor, major, ownership, and total. We found highly-significant positive correlations for major and minor to the number of post-release bugs and a significant correlation between ownership and post-release bugs. Total as the sum of major and minor is ignored.
Coefficients: (1 not defined because of singularities)
                     Estimate Std. Error t value Pr(>|t|)
(Intercept)          -0.39452    0.12820   -3.08  0.00210 **
cleaned_ds$minor      0.25760    0.00448   57.51  < 2e-16 ***
cleaned_ds$major      0.06915    0.01871    3.70  0.00022 ***
cleaned_ds$ownership  0.38927    0.12610    3.09  0.00203 **
cleaned_ds$total           NA         NA      NA       NA
---
Signif. codes:  0 ‘***’ 0.001 ‘**’ 0.01 ‘*’ 0.05 ‘.’ 0.1 ‘ ’ 1

Multiple R-squared:  0.386,	Adjusted R-squared:  0.386
The adjusted r^2 is however quite poor at 0.386.
As seen below, combining both control and independent variables does not meaningfully improve the adjusted r^2 (0.502, up by 0.008). The only independent variable that is significant is minor with a p-value < 0.001.
Coefficients: (1 not defined because of singularities)
                      Estimate Std. Error t value Pr(>|t|)
(Intercept)          -1.69e-01   1.16e-01   -1.47     0.14
cleaned_ds$churn      8.78e-04   3.19e-05   27.49   <2e-16 ***
cleaned_ds$size       1.23e-03   9.84e-05   12.51   <2e-16 ***
cleaned_ds$minor      6.39e-02   6.74e-03    9.47   <2e-16 ***
cleaned_ds$major      2.34e-02   1.69e-02    1.38     0.17
cleaned_ds$total            NA         NA      NA       NA
cleaned_ds$ownership  9.51e-02   1.14e-01    0.84     0.40
---
Signif. codes:  0 ‘***’ 0.001 ‘**’ 0.01 ‘*’ 0.05 ‘.’ 0.1 ‘ ’ 1

Multiple R-squared:  0.503,	Adjusted R-squared:  0.502
Running a 5-fold cross-validation showed our model to be quite robust. Now, what do these results mean? Well, to sum it up:
We failed to establish any meaningful relationship between ownership metrics and the number of post-release bugs for the Rust repository when we control for size and churn.
On possible reasons for this result, I’ll just quote the slides we used during the final presentation:
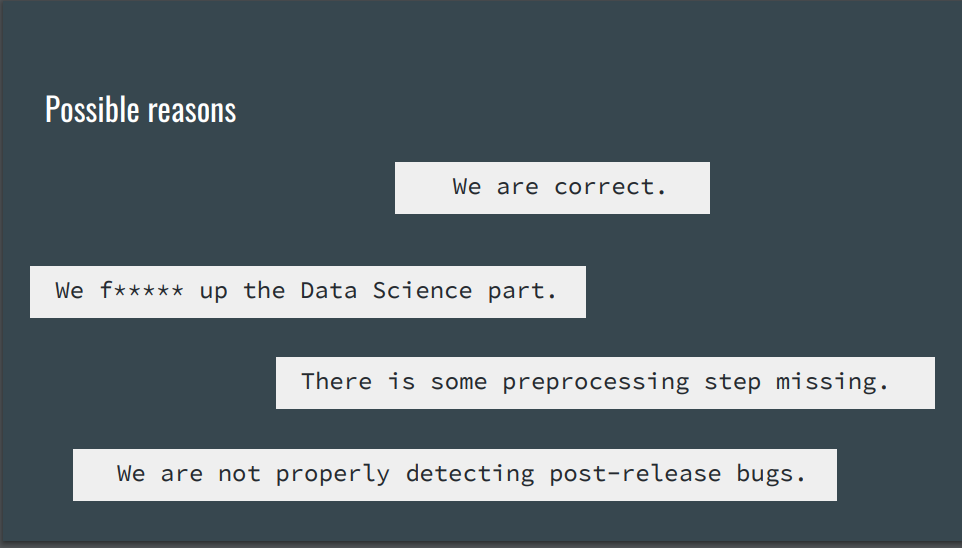
After talking also with the professor and TA the most likely culprit seems to be the last candidate on the list: We found a surpisingly high number of bugs so chances are that we are indeed counting too many things as bug fixes. If this is indeed true and the variable we are trying to predict is very noisy, then the model is of course bound to suffer. A possible way to fix this would be to attempt to not get the information about which commit fixed a bug from the commit message but linking commits to issues in the issue tracker. These issues are often labelled, providing us with more accurate information about what is a bug and what isn’t.
Despite this non-result we were quite satisfied with our work as we had not been expecting to be able to do what a bunch of smart folks at Microsoft Research did over a timeframe of probably several months in just a few days. We had all come to learn new things, and I am certain all of us took a couple of good ideas home with us.

Before heading home to our respective countries once again on Saturday, a bunch of us decided that a visit to the Netherlands without paying at least a short visit to Amsterdam would be a bit strange, so we decided to at least check it out on our way back to the airport (and have delicious fries that were served in portions that were way too big even for me).

All in all, it was an exciting week during which all of us made new friends from all over Europe and learned a ton of new things!
In case you want to have a more in-detail look at our results, you can either check out our presentation or head on over to our repository, where we have both a write-up of the results and all you need to reproduce them.
PS: And before you ask, yes, I did finish those fries – but didn’t eat anything else for the next three weeks. 😉